You might not think of Microsoft PowerPoint as a project management tool. But there's a reason it's used for project updates and by project teams.
The ease-of-use and flexibility of PowerPoint work for any project management professional. It's easy to create a Gantt Chart in PowerPoint (PPT) once you know how.

When it comes to managing projects, you need tools to make them manageable. That includes process charts to help your team collaborate efficiently. Project management professionals often turn to Gantt charts to visualize the parts of the project.
In this tutorial, you'll learn how to create a Gantt chart in PowerPoint. You'll learn how to use an impressive template to build a Gantt chart that ensures that every member of your project team knows how their part in the project fits into the bigger picture. Let's dive in!
What's a Gantt Chart?
Imagine you're building something that requires collaboration with others. That could be a website, new product launch, or even starting your own company. Regardless of what you're starting, there are always many moving parts to make it all come together.
It certainly slows you down if you simply wait for one task to complete to start another. Working on many tasks at the same time so that you don't hit show-stopping bottlenecks is crucial for keeping a project on time and on track.
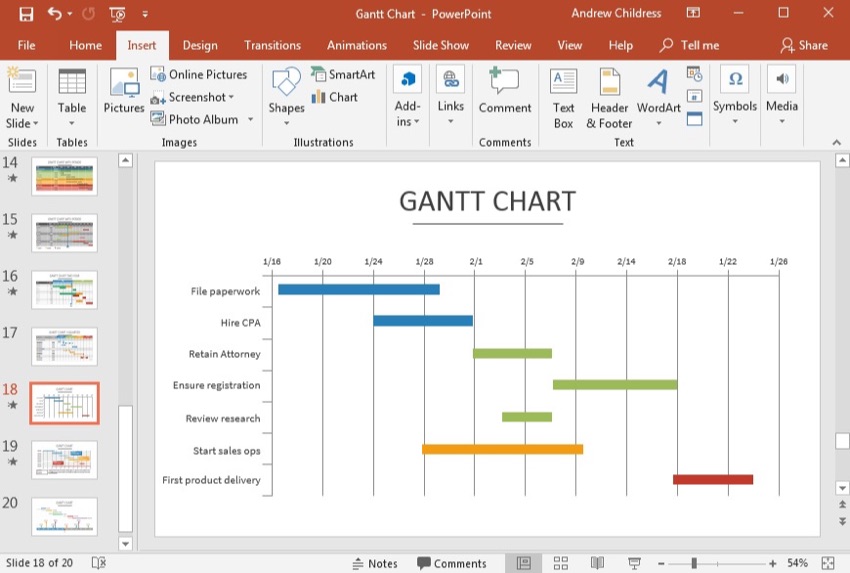
That's where Gantt charts come into play. Gantt charts help you understand not just the list of tasks that need to get done, but the sequence and relation of those tasks. In reality, managing a project of any size comes down to juggling many tasks.
As you can see in the screenshot above, the defining feature of a Gantt chart is that they show many tasks running at the same time. Assign different lines to different members of a team so that everyone can work on their part of the project without encountering bottlenecks.
Interestingly enough, Gantt charts were first used prominently while the Hoover Dam was being built. With so many people working on the project and so many steps needed to finish, Gantt charts were crucial. Whether you're working on something by yourself or with a team, Gantt charts help keep everything balanced and collaborative.

Project management exists to bring sanity to the execution of big ideas. While small tasks don't require systems, you need a way to organize and strategize your next big project.
Even if you aren't building a major construction project, you'll see examples in this tutorial of how helpful Gantt charts in PowerPoint. And, you'll learn how to make Gantt charts in PowerPoint so that you don't have to learn yet another piece of project management software.
If you're looking for other illustrative ways to showcase data and process, it might be time to learn a bit about infographics. Thanks to the broad library of templates on Envato Elements, you can build amazing graphics in PowerPoint as you can see in the round-up below:

The Best Premium Templates for PowerPoint Gantt Charts in 2020
When you know the essential form factor of a Gantt chart, it's possible to create them in Microsoft PowerPoint using shapes and text boxes. But, it's time-consuming, and the result isn't as flexible as it could be.
It's possible to kind of create a Gantt chart using SmartArt in PowerPoint, but it's far from the best method. The ideal approach to creating a Gantt chart in PowerPoint (PPT) is to start with a pre-made template that you can grab from Envato Elements.
Instead of constantly updating and tweaking those lines and shapes, use PowerPoint templates from Elements that are specifically designed with Gantt charts that you need only add your own details to.

If you've not had a chance to check out Envato Elements, it's an all-you-can-download service that every creative should have in their arsenal. Particularly for presentations, there are so many assets and files that you can benefit from and save a ton of money by using.
For a single flat rate monthly fee, you get access to all the following:
- Presentation templates. Many templates are far better than PowerPoint's built-in templates. All included as a part of an Elements subscription.
- Graphics and icons. Need an illustrative icon or graphic, but can't hire an illustrator? Graphics and icons are included and available for use in your presentation for a single flat rate.
- Stock photos. Stock photography isn't cheap, and sourcing random images from the web carries with it the risk of violating the image's copyright.
There's plenty more included like website templates and video. These assets are extremely useful if you prepare presentations often.
Gantt Chart Templates for PowerPoint
In this tutorial, we're going to use the appropriately named Gantt Chart PowerPoint Template from Envato Elements. This amazing template features 19 different styles and designs, but each of them embodies the usefulness and utility of the Gantt chart.
As you can see in the screenshot below, Gantt charts for presentations can take on a variety of styles and designs that you can choose from as a part of the included template.

One more note before we jump into using this template for a Gantt chart: you can also grab premium Gantt PowerPoint templates from GraphicRiver. All these templates include their own renditions of the Gantt style, but all share in common the ease-of-use and customization.
For other types of presentations, don't miss out on the Envato Market top-selling presentation templates.
How to Quickly Build a Gantt Chart in PowerPoint in 2020
In this section of the tutorial, we're going to walk through using PowerPoint to build a Gantt chart. We'll take the template I just showed you and customize it to create a project chart for our own scenario.
I'm going to create a fictitious example of a new product to launch for this article. We'll build out a Gantt that walks through every step of a project.
1. Choose a Slide Design
With so many slide designs to choose from, let's start by selecting a slide to use for an example Gantt chart.
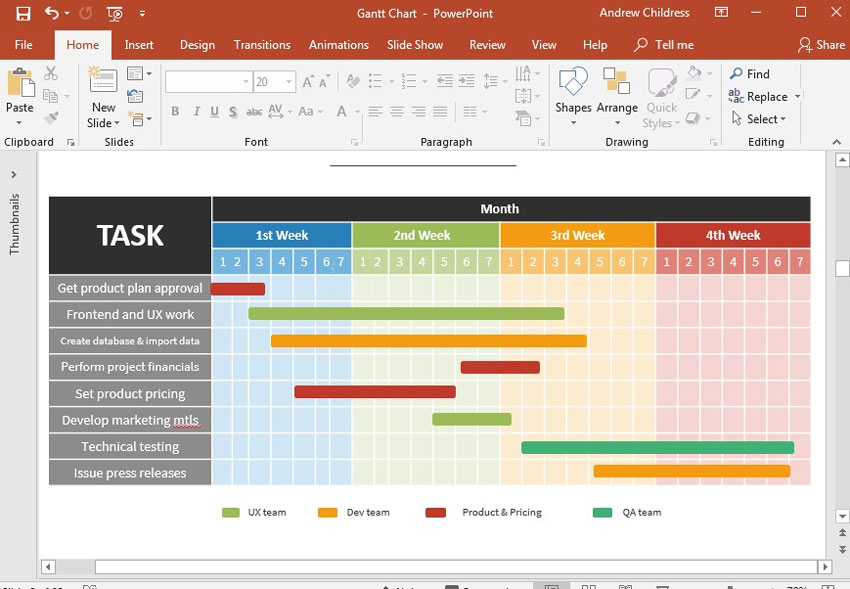
For our walk-through, I'm going to use slide design 6, the "Gantt Chart - 1 month", for example. The main reasons I prefer this slide template are:
- For many product sprints, a single month is usually a reasonable amount of time to add a major feature or implement something new. This is a good type of project to test out using a Gantt chart if your team hasn't used them before.
- The slide design also breaks the month down into an easy-to-monitor set of weeks that ensure a project is still on track.
- It's easy to assign tasks to different team members thanks to the variations in color bars.

Now that we've selected the slide design, let's move onto the next step to continue building out the Gantt chart.
2. List all Tasks for the Gantt Chart
Before you start moving around all the lines on the Gantt chart and trying to estimate how much time each task will take, take inventory of all the functions that are needed to complete the project.

At this point, don't worry about lining up the tasks on the Gantt. Just make sure you've captured all the key dates.
It's important to note that a Gantt chart likely isn't the only tool you use when planning and coordinating a project. You don't have to list every detail along the left side of the chart. Keep it high level and bracket the significant tasks on a project, but not the granular detail.
3. Set a Schedule for the Tasks
Now, it's time to start re-positioning the lines on the Gantt chart so that they follow the schedule you've set for the project.

In this step, I simply drag and drop the lines on the Gantt chart to match the calendar dates at the top of the chart. Notice that on the template we chose, there are separate weeks and days. You want the lines next to the project description to align with the time of the month that the task should be completed.
You might also need to adjust the size of the line depending on how long a task will take to complete. Grab the edge of a rectangle to resize it to match the amount of time a task takes, sizing it to the number of days at the top of the chart.
4. Assign Tasks
Now that we've set up all the tasks in a Gantt chart, it's time to assign them to teams or specific members of a team. My preferred approach here is to use the key at the bottom to assign tasks to a team or individual, each one of them occupying a separate color.
Remember that if you need to re-assign tasks, you can click on one of the lines and choose a new shape color on the ribbon at the top of PowerPoint. Changing this or the key at the bottom of the chart to show who's on point for a task at any given time.
More importantly, this becomes your document that you can use to monitor the progress of a project. Use this chart to keep an eye for who really has the lead on the project at any given moment.
We've just walked through one example of building a Gantt chart. Keep in mind that there are plenty of other styles and designs included with the Gantt template. Each of the 19 slide designs is a different approach to the Gantt chart.
5 Awesome Gantt Chart PowerPoint PPT Templates for 2020
If you’re looking for the best place to download Gantt Chart PowerPoint templates, Envato Elements is the best place to start. Envato Elements has thousands of modern PowerPoint templates with Gantt charts. Download as many as you want for a low monthly fee.

That’s right. Envato Elements allows you to download an unlimited number of Gantt charts PowerPoint templates and other design assets. So, you've got the ultimate creative freedom as you’re building your PowerPoint presentation.
What’s more, customize these templates to match your style. Use amazing, attention-grabbing layouts to convey the key concepts of your presentation with ease.

Another great place to find Gantt charts templates for PowerPoint is GraphicRiver. GraphicRiver allows you to buy single-use PowerPoint templates with stunning and modern Gantt charts designs.
Take a look at some of the best Gantt charts PPT templates from Envato Elements and GraphicRiver:
1. Gantt Chart PowerPoint Template

The first template on the list comes with 10 premade color schemes and 27 unique Gantt chart templates. Easily customize the colors and adjust the charts to your specific data. The template was designed in widescreen resolution.
2. Minimal Gantt Chart PowerPoint Template Design

The Minimal Gantt chart PPT template has a simple yet visually appealing design. The template includes 19 various Gantt chart templates. So, you can easily incorporate the one that suits your needs into your presentation. The template was designed in widescreen resolution and is easy to edit.
3. Business Plan Gantt Chart PPT Template

This template is a great choice if you want a powerful business plan presentation with Gantt charts included. The template includes a total of 20 premade color schemes and over 100 unique slides including Gantt chart slides. This template was designed in widescreen resolution.
4. Gantt Charts PowerPoint Template

This Gantt chart PPT template has 50 unique slides and five premade color schemes. Quickly add the desired Gantt chart to your presentation. The template includes both animated and non-animated slides. It comes in widescreen and standard resolution.
5. Animated Gantt Chart PowerPoint Template

If you’re looking for an animated Gantt chart PPT template, check this template out. It includes various Gantt chart layouts that are easy to edit and come with image placeholders. The template was designed in widescreen and standard resolution.
More Awesome PowerPoint Templates
Gantt chart templates for PowerPoint make it easy to present your data in a presentation. To see even more examples of awesome PowerPoint templates be sure to check out the roundups below:
 Microsoft PowerPoint25 Best Fully-Customizable PowerPoint Templates (Make Custom Quick 2020)
 Microsoft PowerPoint32+ Professional PowerPoint Templates: For Better Business PPT Presentations
 Microsoft PowerPoint25 Best PowerPoint Slide Design Templates (PPT Downloads for 2020)
5 Quick Tips for Better Gantt Charts in PowerPoint
A great Gantt chart PPT template gives you a starting point for your presentation. To make sure your Gantt charts are easy to understand and make an impact, here are five quick tips:
1. Use Meaningful Task Names
Your Gantt chart will be easier to understand if you use descriptive task names that everyone on your team can understand. Avoid using names such as Development Stage 1 or Testing Phase 3.

2. Show Milestones
Milestones make it easy to ensure your project is on track. Be sure to include them in your Gantt chart. Spread them out so you and your team have plenty of time to execute the tasks and meet the designated milestone.
3. Link Your Tasks
No matter how big your project is, chances are your tasks will be interlinked with one another. A great Gantt chart shows the link between tasks. So, each team knows how the work flows through the project and which dependencies may delay the project.

4. Take It a Step Further With Allocated Resources
Adding a team member’s name or a team name to your Gantt chart makes it easy to see who’s responsible for what at a glance.
5. Group Tasks Together
Lastly, if you’re dealing with a long or complicated project, consider grouping tasks together. This makes it easier to manage the project on a Gantt chart without making your chart look overwhelming.

Learn More About Making Great Gantt Charts
In this tutorial, you learned more about the power of Gantt charts and how you can use them to manage a project. You've seen how easy it is to build one in an app like PowerPoint when you start with a pre-made template.
To learn more about designing a great looking PowerPoint presentation, I always recommend starting with our top resource, the Ultimate Guide to the Best PPT.
Want to find out more? Learn more creating Gantt charts in other applications, and other charts you can build in PowerPoint, in the articles below:
 KeynoteHow to Make Flowcharts & Gantt Charts in Keynote With Templates
 Microsoft ExcelHow to Make a Gantt Chart in Excel
.jpg) Microsoft PowerPointHow to Create Organizational Charts in PowerPoint With PPT Templates
Microsoft PowerPointHow to Create Organizational Charts in PowerPoint With PPT Templates
Get a Free PDF eBook Download on Presentations
Our presentation eBook will walk you through the complete presentation process. Learn how to write your presentation, design it like a pro, and prepare it to present powerfully. Download our eBook: The Complete Guide to Making Great Presentations. It's available for free with a subscription to the Tuts+ Business Newsletter.

Create Gantt Charts Quickly With PowerPoint Templates
If you need a Gantt chart for your presentation, a template is a good place to start. You can find some great Gantt charts PowerPoint templates on Envato Elements or GraphicRiver. Why not download one today?
Have you ever used a Gantt chart for a presentation? How do you leverage them to ensure a project stays on track and on time? Let me know in the comments section below if you've got a favorite tip to share.
Editorial Note: This post was originally published in October of 2018. It's been revised to make it current, accurate, and up to date by our staff—with special help from Brenda Barron.

No comments:
Post a Comment